In Australia, there’s one topic that arguably generates the most heated debate of all: the issue of housing.
Like most debates that are heavily influenced by emotion and personal lived experience, it is an arena in which myths propagate and spread, regardless of how factual or accurate their basis may be.
Rather than stepping into this debate in the usual fashion with one’s own experiences defining one’s perspective, we are going to look at some of the myth’s surrounding young people and Aussie housing from a data driven perspective.
Myth 1: Young people spend money frivolously, that’s why they can’t afford homes
This is one of those myths that has a grain of truth in it and it can be easy to find anecdotes of people who it’s true of. However, despite some of us having young people who spend frivolously in our social circles, the aggregate data paints a very different picture of the spending habits of younger demographics.
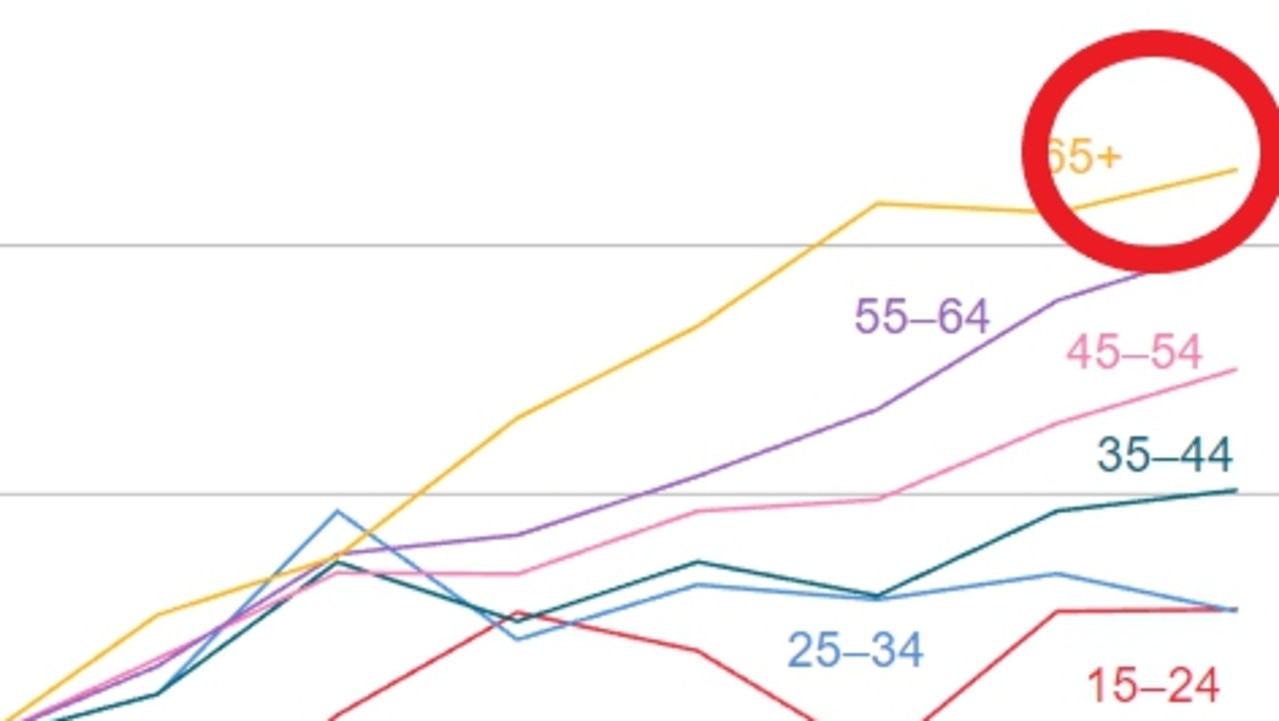
In 2020, the RBA produced a paper which broke down per inflation adjusted household consumption growth from 2003-04 to 2017-18 by age demographic of a household’s reference person. It found that in 2018 households with a reference person aged 25-34 consumed less goods and services than a household in this age group did in 2007. For households with a reference person aged 15-24, they consumed a broadly similar amount of goods and services in 2018 as they did in 2009.
More recent data paints an even more challenging picture for Australians under 35. According to figures provided by the Commonwealth Bank, spending for customers aged 18 to 24 and 25 to 34 is down compared with this time last year.
Considering that inflation is running at 6.0 per cent, this implies a sizeable fall in inflation adjusted consumption for these demographics in aggregate. These age demographics were also the only age demographics to experience to falling levels of overall savings (including offsets and all deposits).
Myth 2: If young people worked harder, they could afford homes
According to the latest data from the ABS, over 958,000 workers are currently holding down multiple jobs. This equates to 6.68 per cent of the labour force, the highest proportion in at least 25 years.
Despite more and more Australians working multiple jobs, the scope of the challenge that is buying a home has grown to such a degree that for many simply working harder can still leave one coming up short.
Naturally the degree of the challenge varies significantly from city to city, with very different housing prices and median household incomes at work. For example, for a household with a 20 per cent deposit and extra cash for stamp duty to afford a starter home (80 per cent of median house price) in Sydney on a 30-year mortgage, they would need an income of over $212,000 to avoid mortgage stress. Historically mortgage stress was defined as a household spending more than 30 per cent of their household income on servicing their loan.
At the other end of the spectrum, a household an income of $89,000 is required to purchase a starter home in Darwin under the same settings, with the other capital cities around the nation sitting somewhere between these two extremes.
Myth 3: Young people just don’t save for deposits like they used to
It’s worth starting off by stating that some elements of this myth are true. Younger Australian demographics simply haven’t had the same access to the high interest rates on their home deposit savings as older demographics.
For example, for a Baby Boomer born in the middle of their generation (1955) and starting to save for a home deposit at age 28 (1983), the average one-year term deposit interest rate over the next five years was 12.52 per cent.
Meanwhile, the average one-year term deposit interest rate over the past five years was 1.38 per cent. If we take the five years prior to the pandemic as the benchmark, the figure rises to 2.16 per cent.
For this reason, it would be highly unlikely for younger Australians to grow their savings at the same rate as previous generations who enjoyed the benefit of higher interest rates.
The size of the deposit hurdle has also grown significantly greater over time relative to incomes.
According to an analysis by AMP based on data from CoreLogic, as late as 2000 a 20 per cent house deposit could be saved in a little over 5.5 years. In the present day that figure is now closer to 10.5 years, down from a peak of over 11 years recorded in 2021.
Myth 4: Young people aren’t willing to get out there and work like previous generations
At the turn of the new millennium, the rolling 12-month average for labour force participation by Australians aged 20 to 24 was 81.8 per cent and 80.1 per cent for those aged 25 to 34. The rolling 12-month average was chosen due to the fact that seasonality can have a significant impact on any given month, so a rolling average is a better guide of the overall trend.
Fast forward to 2023 and 83.8 per cent of people aged 20-24 are in the labour force, along with 87.0 per cent of those aged 25 to 34. On a combined basis, the current economic cycle has seen the greatest level of workforce participation from these demographics since comparable records began back in 1978.
With the unemployment rate near five-decade lows, a greater proportion of Australians in the 20 to 34 age demographics were recently in some form of work than ever before.
For this reason, its pretty hard to make the assertion that younger people are unwilling to get out there and work.
Tarric Brooker is a freelance journalist and social commentator | @AvidCommentator

